 |
| How Distribution Systems Control Customer Loads? |
Distribution Systems
Distribution systems obviously exist to supply electricity to end users, so loads and their characteristics are important. Utilities supply a broad range of loads, from rural areas with load densities of 10 kVA/mi2 to urban areas with 300 MVA/mi2. A utility may feed houses with a 10- to 20-kVA peak load on the same circuit as an industrial customer peaking at 5 MW.
The electrical load on a feeder is the sum of all individual customer loads. And the electrical load of a customer is the sum of the load drawn by the customer’s individual appliances.
Customer loads have many common characteristics. Load levels vary through the day, peaking in the afternoon or early evening.
Load characteristics
Several definitions are used to quantify load characteristics at a given location on a circuit:
- Demand
- Load factor
- Coincident factor
- Diversity factor
- Responsibility factor
Demand
The load average over a specified time period, often 15, 20, or 30 minutes.
Demand can be used to characterize real power, reactive power, total power, or current.
Peak demand over some period of time is the most common way utilities quantify a circuit’s load. In substations, it is common to track the current demand.
Load factor
The ratio of the average load over the peak load. Peak load is normally the maximum demand but may be the instantaneous peak. The load factor is between zero and one.
A load factor close to 1.0 indicates that the load runs almost constantly. A low load factor indicates a more widely varying load. From the utility point of view, it is better to have high load-factor loads.
Load factor is normally found from the total energy used (kilowatt-hours) as:

where:
LF = load factor
kWh = energy use in kilowatt-hours
dkW = peak demand in kilowatts
h = number of hours during the time period
kWh = energy use in kilowatt-hours
dkW = peak demand in kilowatts
h = number of hours during the time period
Coincident factor
The ratio of the peak demand of a whole system to the sum of the individual peak demands within that system. The peak demand of the whole system is referred to as the peak diversified demand or as the peak coincident demand.
The individual peak demands are the non-coincident demands.
The coincident factor is less than or equal to one. Normally, the coincident factor is much less than one because each of the individual loads do not hit their peak at the same time (they are not coincident).
Diversity factor
The ratio of the sum of the individual peak demands in a system to the peak demand of the whole system. The diversity factor is greater than or equal to one and is the reciprocal of the coincident factor.
Responsibility factor
The ratio of a load’s demand at the time of the system peak to its peak demand. A load with a responsibility factor of one peaks at the same time as the overall system.
The responsibility factor can be applied to individual customers, customer classes, or circuit sections.
The loads of certain customer classes tend to vary in similar patterns.
Commercial loads are highest from 8 a.m. to 6 p.m. Residential loads peak in the evening. Weather significantly changes loading levels. On hot summer days, air conditioning increases the demand and reduces the diversity among loads. At the transformer level, load factors of 0.4 to 0.6 are typical
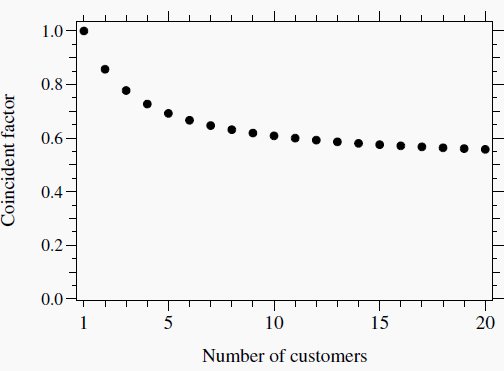
Several groups have evaluated coincidence factors as a function of the number of customers. Nickel and Braunstein (1981) determined that one curve fell roughly in the middle of several curves evaluated.
Used by Arkansas Power and Light, this curve fits the following:

where n is the number of customers (see Figure 1).
 |
| Figure 1 - Coincident factor average curve for utilities |
At the substation level, coincidence is also apparent. A transformer with four feeders, each peaking at 100 A, will peak at less than 400 A because of diversity between feeders.
The coincident factor between four feeders is normally higher than coincident factors at the individual customer level.
Expect coincident factors to be above 0.9.
Each feeder is already highly diversified, so not much more is gained by grouping more customers together if the sets of customers are similar. If the customer mix on each feeder is different, then multiple feeders can have significant differences.
If some feeders are mainly residential and others are commercial, the peak load of the feeders together can be significantly lower than the sum of the peaks.
 |
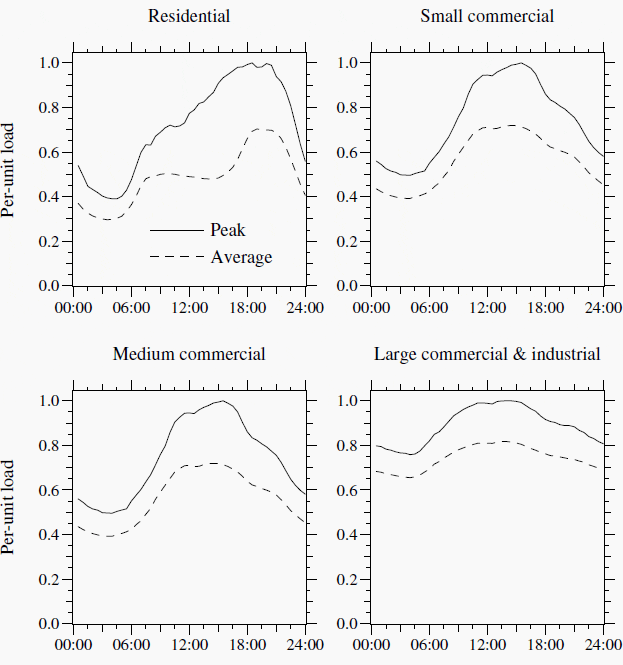
| Figure 2 - Daily load profiles for Pacific Gas and Electric |
For distribution transformers, the peak responsibility factor ranges from 0.5 to 0.9 with 0.75 being typical (Nickel and Braunstein, 1981). Different customer classes have different characteristics (see Figure 2 for an example).
Residential loads peak more in the evening and have a relatively low load factor. Commercial loads tend to be more 8 a.m. to 6 p.m., and the industrial loads tend to run continuously and, as a class, they have a higher load factor.
No comments:
Post a Comment