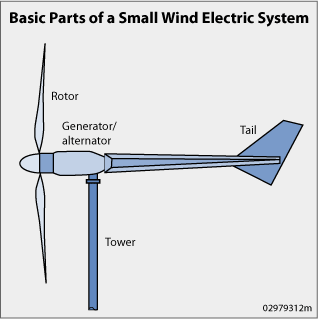
One of the most critical features of wind generation is the
variability of wind. Wind speeds vary with time of day, time of year,
height above ground, and location on the earth’s surface. This makes
wind generators into what might be called energy producers rather than
power producers.
That is, it is easier to estimate the energy
production for the next month or year than it is to estimate the power
that will be produced at 4:00 PM next Tuesday. Wind power is not
dispatchable in the same manner as a gas turbine. A gas turbine can be
scheduled to come on at a given time and to be turned off at a later
time, with full power production in between. A wind turbine produces
only when the wind is available.
At a good site, the power output
will be zero (or very small) for perhaps 10% of the time, rated for
perhaps another 10% of the time, and at some intermediate value the
remaining 80% of the time.
This variability means that some sort
of storage is necessary for a utility to meet the demands of its
customers, when wind turbines are supplying part of the energy. This is
not a problem for penetrations of wind turbines less than a few percent
of the utility peak demand. In small concentrations, wind turbines act
like negative load. That is, an increase in wind speed is no different
in its effect than a customer turning off load. The control systems on
the other utility generation sense that generation is greater than load,
and decrease the fuel supply to bring generation into equilibrium with
load. In this case, storage is in the form of coal in the pile or
natural gas in the well.
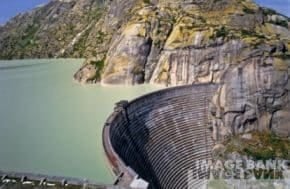
An
excellent form of storage is water in a hydroelectric lake. Most
hydroelectric plants are sized large enough to not be able to operate
full-time at peak power. They therefore must cut back part of the time
because of the lack of water.
A combination hydro and wind plant
can conserve water when the wind is blowing, and use the water later,
when the wind is not blowing. When high-temperature superconductors
become a little less expensive, energy storage in a magnetic field will
be an exciting possibility. Each wind turbine can have its own
superconducting coil storage unit.
This
immediately converts the wind generator from an energy producer to a
peak power producer, fully dis-patchable. Dis-patchable peak power is
always worth more than the fuel cost savings of an energy producer.
Utilities with adequate base load generation (at low fuel costs) would
become more interested in wind power if it were a dis-patchable peak
power generator.
The variation of wind speed with time of day is
called the diurnal cycle. Near the earth’s surface, winds are usually
greater during the middle of the day and decrease at night. This is due
to solar heating, which causes “bubbles” of warm air to rise. The rising
air is replaced by cooler air from above. This thermal mixing causes
wind speeds to have only a slight increase with height for the first
hundred meters or so above the earth. At night, however, the mixing
stops, the air near the earth slows to a stop, and the winds above some
height (usually 30 to 100 m) actually increase over the daytime value. A
turbine on a short tower will produce a greater proportion of its
energy during daylight hours, while a turbine on a very tall tower will
produce a greater proportion at night.
As tower height is increased, a given generator will produce substantially more energy.
However,
most of the extra energy will be produced at night, when it is not
worth very much. Standard heights have been increasing in recent years,
from 50 to 65 m or even more. A taller tower gets the blades into less
turbulent air, a definite advantage.
The disadvantages are extra
cost and more danger from overturning in high winds. A very careful look
should be given the economics before buying a tower that is
significantly taller than whatever is sold as a standard height for a
given turbine.
Wind speeds also vary strongly with time of year.
In the southern Great Plains (Kansas, Oklahoma, and Texas), the winds
are strongest in the spring (March and April) and weakest in the summer
(July and August). Utilities here are summer peaking, and hence need the
most power when winds are the lowest and the least power when winds are
highest. The diurnal variation of wind power is thus a fairly good
match to utility needs, while the yearly variation is not.
TABLE 1
Monthly Average Wind Speed in MPH and Projected Energy Production at 65 m, at a Good Site in Southern Kansas
Monthly Average Wind Speed in MPH and Projected Energy Production at 65 m, at a Good Site in Southern Kansas
| 10 m | 60 m | Energy | 10 m | 60 m | Energy | ||
| Month | Speed | Speed | (MWh) | Month | Speed | Speed | (MWh) |
| 1/96 | 14.9 | 20.3 | 256 | 1/97 | 15.8 | 21.2 | 269 |
| 2/96 | 16.2 | 22.4 | 290 | 2/97 | 14.7 | 19.0 | 207 |
| 3/96 | 17.6 | 22.3 | 281 | 3/97 | 17.4 | 22.8 | 291 |
| 4/96 | 19.8 | 25.2 | 322 | 4/97 | 15.9 | 20.4 | 242 |
| 5/96 | 18.4 | 23.1 | 297 | 5/97 | 15.2 | 19.8 | 236 |
| 6/96 | 13.5 | 18.2 | 203 | 6/97 | 11.9 | 16.3 | 167 |
| 7/96 | 12.5 | 16.5 | 169 | 7/97 | 13.3 | 18.5 | 212 |
| 8/96 | 11.6 | 16.0 | 156 | 8/97 | 11.7 | 16.9 | 176 |
| 9/96 | 12.4 | 17.2 | 182 | 9/97 | 13.6 | 19.0 | 211 |
| 10/96 | 17.1 | 23.3 | 320 | 10/97 | 15.0 | 21.1 | 265 |
| 11/96 | 15.3 | 20.0 | 235 | 11/97 | 14.3 | 19.7 | 239 |
| 12/96 | 15.1 | 20.1 | 247 | 12/97 | 13.6 | 19.5 | 235 |
The
variability of wind with month of year and height above ground is
illustrated in Table 1. These are actual wind speed data for a good site
in Kansas, and projected electrical generation of a Vestas turbine
(V47-660) at that site. Anemometers were located at 10, 40, and 60 m
above ground. Wind speeds at 40 and 60 m were used to estimate the wind
speed at 65 m (the nominal tower height of the V47-660) and to calculate
the expected energy production from this turbine at this height. Data
have been normalized for a 30-day month. There can be a factor of two
between a poor month and an excellent month (156 MWh in 8/96 to 322 MWh
in 4/96). There will not be as much variation from one year to the next,
perhaps 10 to 20%.
A wind power plant developer would like to
have as long a data set as possible, with an absolute minimum of one
year. If the one year of data happens to be for the best year in the
decade, followed by several below average years, a developer could
easily get into financial trouble. The risk gets smaller if the data set
is at least two years long.
One would think that long-term
airport data could be used to predict whether a given data set was
collected in a high or low wind period for a given part of the country,
but this is not always true. One study showed that the correlation
between average annual wind speeds at Russell, Kansas, and Dodge City,
Kansas, was 0.596 while the correlation between Russell and Wichita was
0.115.
The terrain around Russell is very similar to that around
Wichita, and there is no obvious reason why wind speeds should be high
at one site and low at the other for one year, and then swap roles the
next year.
There is also concern about long-term variation in wind
speeds. There appears to be an increase in global temperatures over the
past decade or so, which would probably have an impact on wind speeds.
It also appears that wind speeds have been somewhat lower as
temperatures have risen, at least in Kansas. It appears that wind speeds
can vary significantly over relatively short distances. A good data set
at one location may under-predict or over-predict the winds at a site a
few miles away by as much as 10 to 20%. Airport data collected on a 7-m
tower in a flat river valley may underestimate the true surrounding
hilltop winds by a factor of two.
If economics are critical, a
wind power plant developer needs to acquire rights to a site and collect
wind speed data for at least one or two years before committing to
actually constructing turbines there.


